Origins to Innovation: Cloud Computing's Impact on HR
Do you know why it's called cloud computing and are you aware of the benefits to HR?
- 06 Jun 2024
- Max 11 min read
The Number One HR Solution on Salesforce
A human resources (HR) diagram or org chart visually represents an organization's structure or processes. A HR diagram shows the relationships between employees, managers, supervisors, and other organizational units.
Although human resources diagrams are often used to show the hierarchy within an organization, they can also be used to map out the pathway of various HR processes, expected outcomes, and even skill sets.
Outlining the organizational structure, these charts also provide information about the roles and responsibilities of each employee by helping to visualize the flow of information throughout the company. Such a diagram can give a clear picture of HR management and company workflows, who does what, and where team members fit into the organization.
Having an HR diagram can be an important asset and create a framework for success in your company. However, creating one is more complicated than it sounds, but if you have found your way to this article, that means that you are already one step closer.
A Human Resource Diagram is an anomaly in terms of visual representations as the emphasis is on the structure, and aesthetics is less important. The HR department creates this kind of diagram in order to visualize, plan, and manage the human capital, human resource functions, and processes of a company.
HR diagrams work to optimize employee productivity and process performance. There are a number of benefits that come from creating and utilizing an HR diagram, namely:
Ultimately all of these benefits come together to ensure that your business operates seamlessly.
When we talk about human resource diagrams, your mind may jump immediately to an HR organization chart. However, there are three more types of HR diagrams that we are also going to discuss today:
Companies are built up of different processes and functions. Your HR department is no different. HR processes include payroll, employee benefits, conflict resolution, recruitment and retention, onboarding, and proper training. These processes are all set up, follow a number of steps, and arrive at a pre-determined outcome with the least amount of effort.
A lot can go wrong in formulating these processes that can lead to the downfall of your company, or at the very least, your HR department. Having an HR process management flowchart on hand allows you to accurately visualize your processes and see the potential for increased efficiency.
Think of an HR process management flowchart as a type of action plan.
Having a ‘birds-eye view’ of your operations allows you to monitor the progress of these processes and identify errors and opportunities. These kinds of HR diagrams are particularly important when planning to implement a change within your organization as they allow you to preempt the effects that change may have.
Let’s take a look at two standard HR processes, recruitment, and development, that are often at the center of a basic flowchart diagram.
Recruitment is a fundamental HR process. It is near impossible for a company to expand without hiring more skilled employees. Recruitment includes attracting talent, selecting the right applicants, and then appointing them to the correct positions within the company.

The nature and scale of your recruitment heavily depend on the type of company you work for and the type of roles you’re hiring for. It is vital to have a set pathway for recruitment that outlines any methods and includes the necessary criteria at each step.
This kind of HR process management flowchart is particularly useful in a hybrid workspace or remote working situation when your HR team may not be sitting in the same space and may not be able to discuss the process as it goes on.
Another vital HR process that follows after successful recruitment is development.
Development, in this case, refers to the onboarding of new employees and the ongoing training and upskilling of current employees. Onboarding and training ensure that you have equipped your employees with the tools, skills, and knowledge they need in order to perform their job to the best of their ability.
Having an HR development process flowchart ensures that development across your company is standardized, continuous, and readily available to everyone.
We guarantee that something will go wrong during your company lifecycle, either between employees or within a process.
When it does go wrong, an HR fishbone or problem-solving diagram can be used to identify the cause of the issue.
Calling these diagrams ‘problem-solving’ describes their function, whereas calling them ‘fishbone’ describes their structure. These diagrams are set up to look similar to a fish skeleton where the problem is at the head of the fish and the potential causes form the bones.
HR fishbone diagrams enable HR employees to investigate cause-effect relationships via the gathering of information by asking questions, the analysis of this information, and the drawing of a conclusion.
Having a diagram like this on hand allows you to speed up the problem-solving process and implement an effective solution as soon as possible.
The quicker your HR team can get to the root of the problem, the better.
As you may have already guessed, a human resources organizational chart shows the whole company's structure, a department, or an individual team.
However, the HR organizational chart goes over and above, just indicating hierarchy. It also includes employee relations, employee names, and their specific job roles.
These particular charts are extremely useful for larger organizations with several different hierarchical layers and a variety of roles. They can even go as far as to include business partners.
An HR organizational chart allows individuals at the company to have better clarity on their roles and responsibilities, giving them a better sense of where they fit into the company as a whole.

Since an HR organization chart outlines the company structure, it makes it easy for the HR team to relay any employee-related issues or disciplinary issues to the correct manager who has to deal with them.
Another benefit of creating an HR organizational chart is that it allows you to identify departments or teams that have the ability to grow with the addition of some new members. Knowing your human resource capacity limits will allow you to hire efficiently.
A human resource matrix diagram is similar to an HR organizational chart. Therefore it contains similar information. What makes the HR matrix diagram different is its layout. It is laid out in a grid format.
An HR matrix diagram is used to map out the more complex hierarchy where employees report to multiple managers, multiple departments, or through various channels.
Creating an HR matrix indicates to employees where they stand in the company and to whom they report. This helps to facilitate efficient feedback and quick decision-making, leading to a faster employee and company-wide growth.
Having the vertical and horizontal hierarchy mapped out helps to avoid information silos and allows the smooth transfer of information and skills between different parties. Essentially, it facilitates collaboration and communication within the organization.
In order to create an effective and functional human resource process flow diagram, you need to have gone through the process of human resource planning. The human resource planning process involves understanding your current business needs, the direction you’re heading in, and the staffing levels you need to get you there.
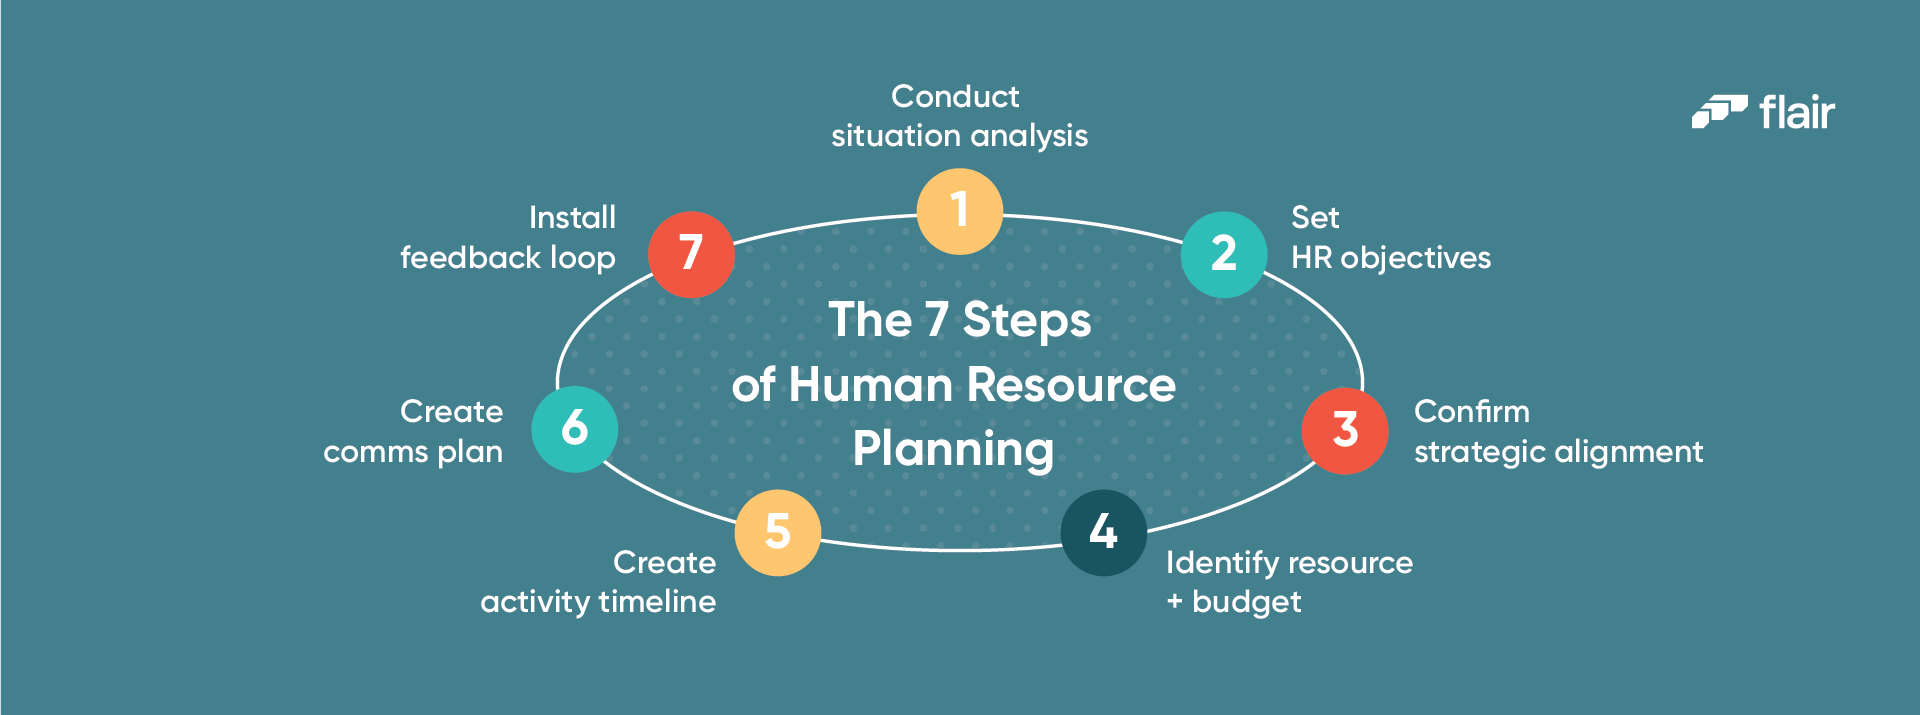
However, having a human resource diagram also supports the human resource planning process as it makes it easier to analyze process performance and identify employment opportunities.
Therefore the human resource planning process and human resource diagrams feed into each other.
The type of human resource diagram you’re making determines how you create your human resource diagram. However, there are a number of steps that apply to them all.
To make a human resource diagram, all you need to do is follow these nine steps:
1. Identify and Set Your Company Objectives
The first step is to identify the company's purpose and set the key objectives that need to be met to achieve this purpose.
2. Identify Your HR Processes and Team Structures
Ensure that you audit the human capital, and understand the HR structures and business processes your company has at its disposal.
3. Gather Information on Your Employees and Processes
To create an accurate diagram you need to have in-depth information on your employees and what they do as well as how all the processes are expected to perform.
4. Make Sure You Have a Diagram Tool on Hand
While you can draw your diagram by hand, using an online tool allows you to quickly make any changes you need to make in the future. Using a tool such as LucidChart, saves you valuable time regarding chart creation and display.
5. Use a Top-Down Approach
When you’re creating your diagram, you need to start at the top and work down. This applies whether you are visualizing your employee structure or your processes.
For organizational charts, start with the leader or manager at the top, and for process flowcharts, always begin with the very first function.
6. Clearly Indicate Separate Items
To make your diagram readable, each item needs to be differentiated from one another. In most HR diagrams, this is done using different shapes, icons, or colors.
7. Connect Related Items
Whether they are employees that are linked within the structure or process steps that lead to one another, it is essential to connect these items in your diagram with some sort of linking element such as a line or an arrow.
8. Share Your Diagram With Your Employees
There is no point in creating a human resource diagram and keeping it to yourself. It is important to share your diagram amongst your employees so that they also benefit from it.
9. Make Sure to Update Your Diagram Regularly
Whether you have just hired a new employee or let one go, it is essential to update your HR diagram accordingly, especially if it changes the hierarchical structure. The same goes for when you alter your processes, get rid of one, or discover a new innovative one to include.
If you do not update your HR diagrams, you risk using outdated information to make decisions and confusing current employees.
Although your human resource diagrams will depend on your company, its employees, and its processes, here are a couple of examples that you can use as the basis for your own.
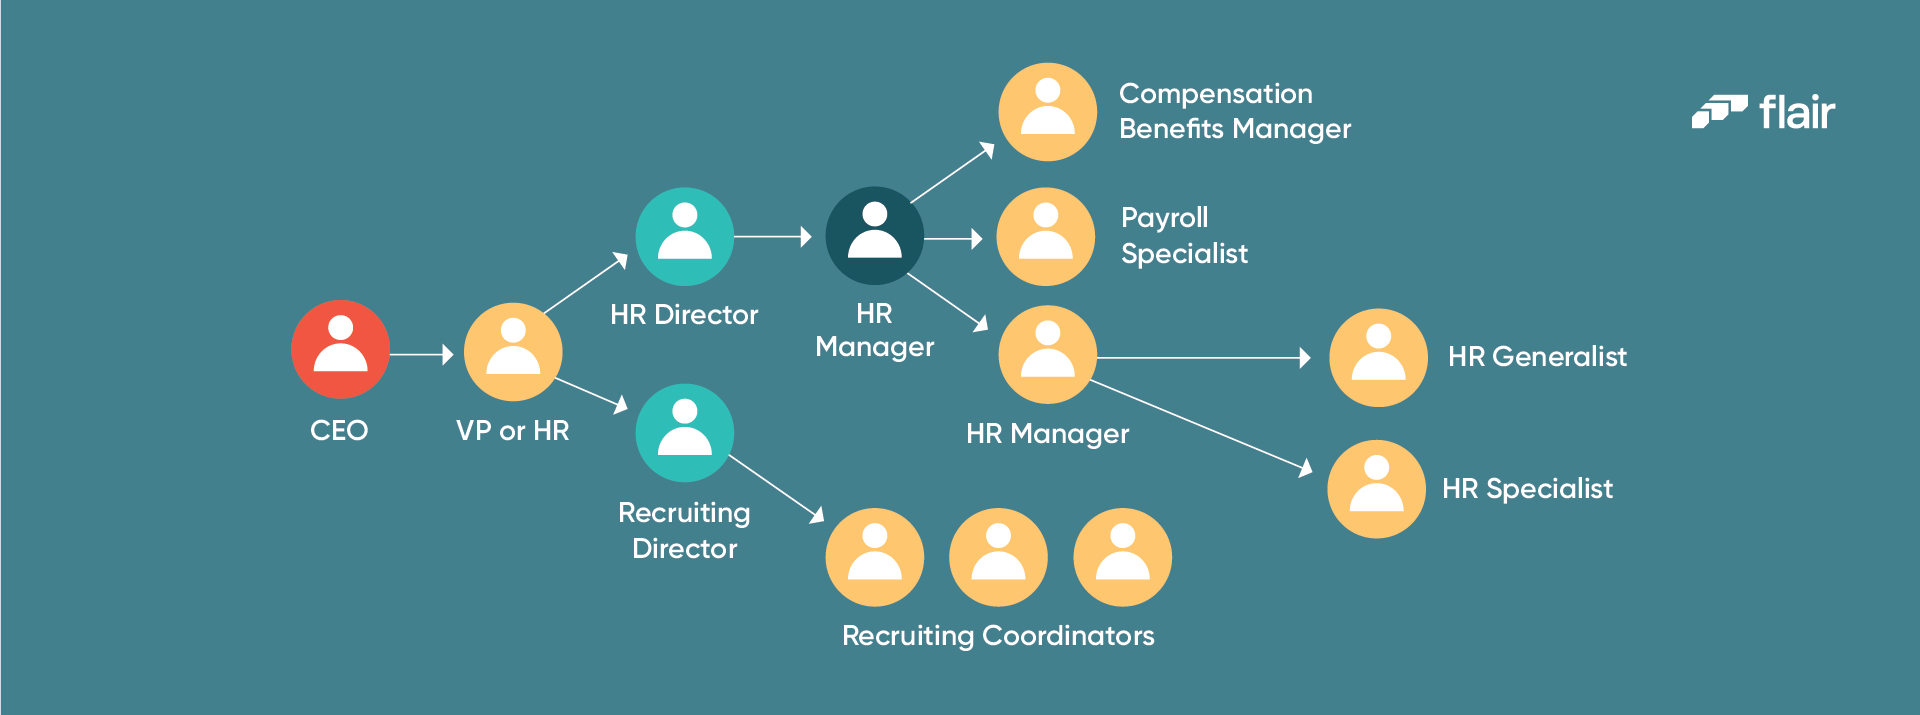
Here is a classic example of an HR organizational chart.
Each item (in this case, job role) is differentiated by circles with a ‘person icon,’ and the hierarchy between these positions is shown by the layout of the diagram as well as the arrows connecting the items.
You could take this visual diagram a step further and include the names of the current employees who are fitted in each role as well as the specific aspects they are responsible for.
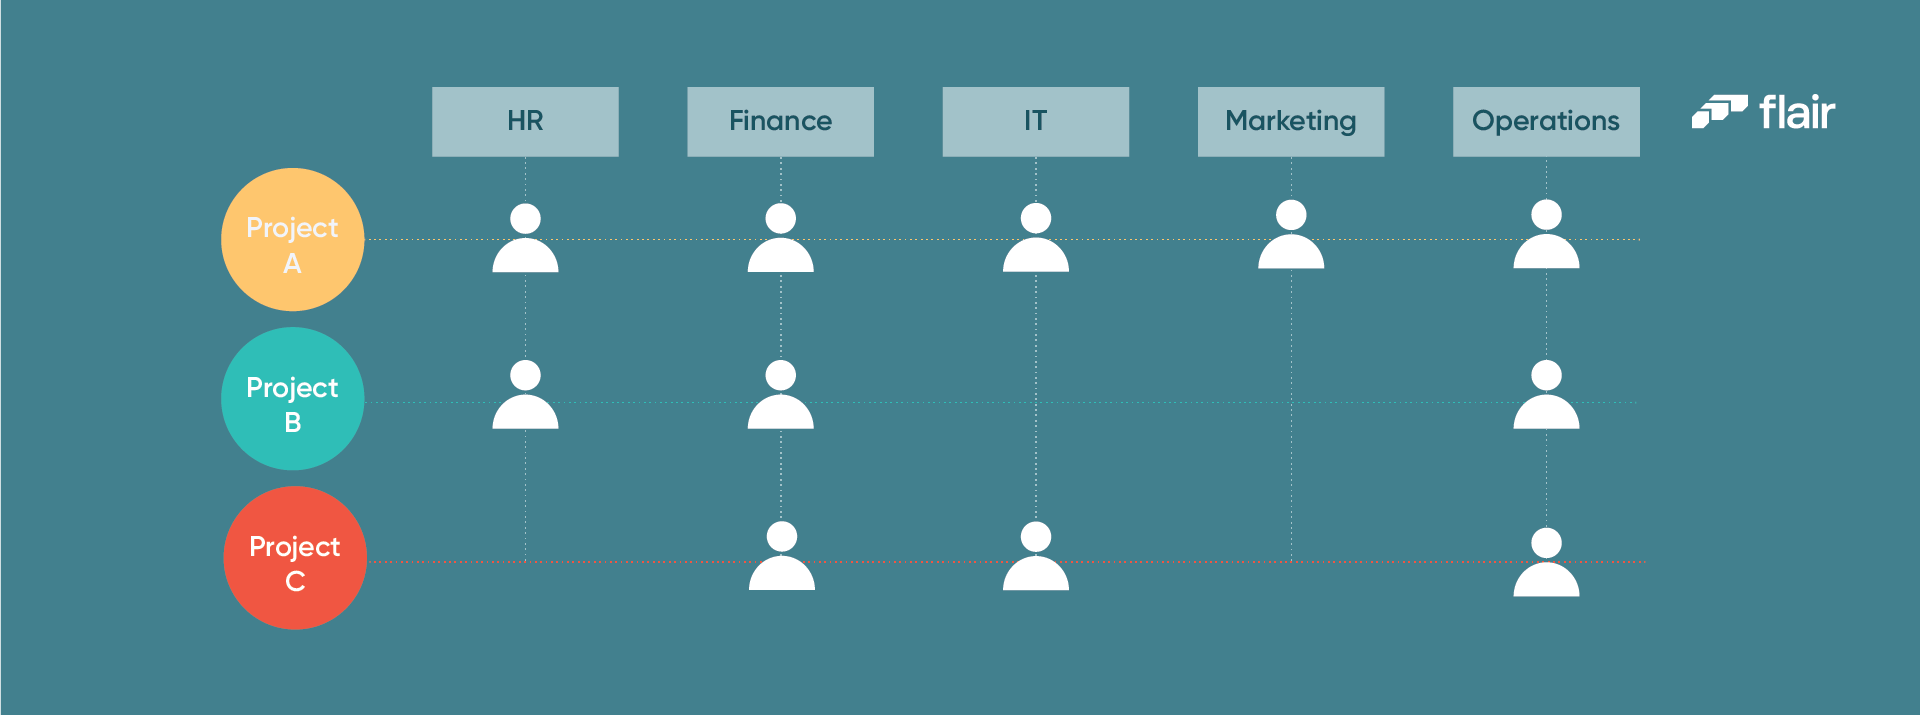
Although this is an elementary HR matrix diagram, it showcases simply what these diagrams may look like.
Across the top are the different departments within a company, and down the side are the different projects that are on the go. The ‘person icon,’ faint dotted lines, and grid layout indicate who belongs to each department and which projects they are working on.
The one thing this matrix diagram is missing is the job roles and employee names of each person.
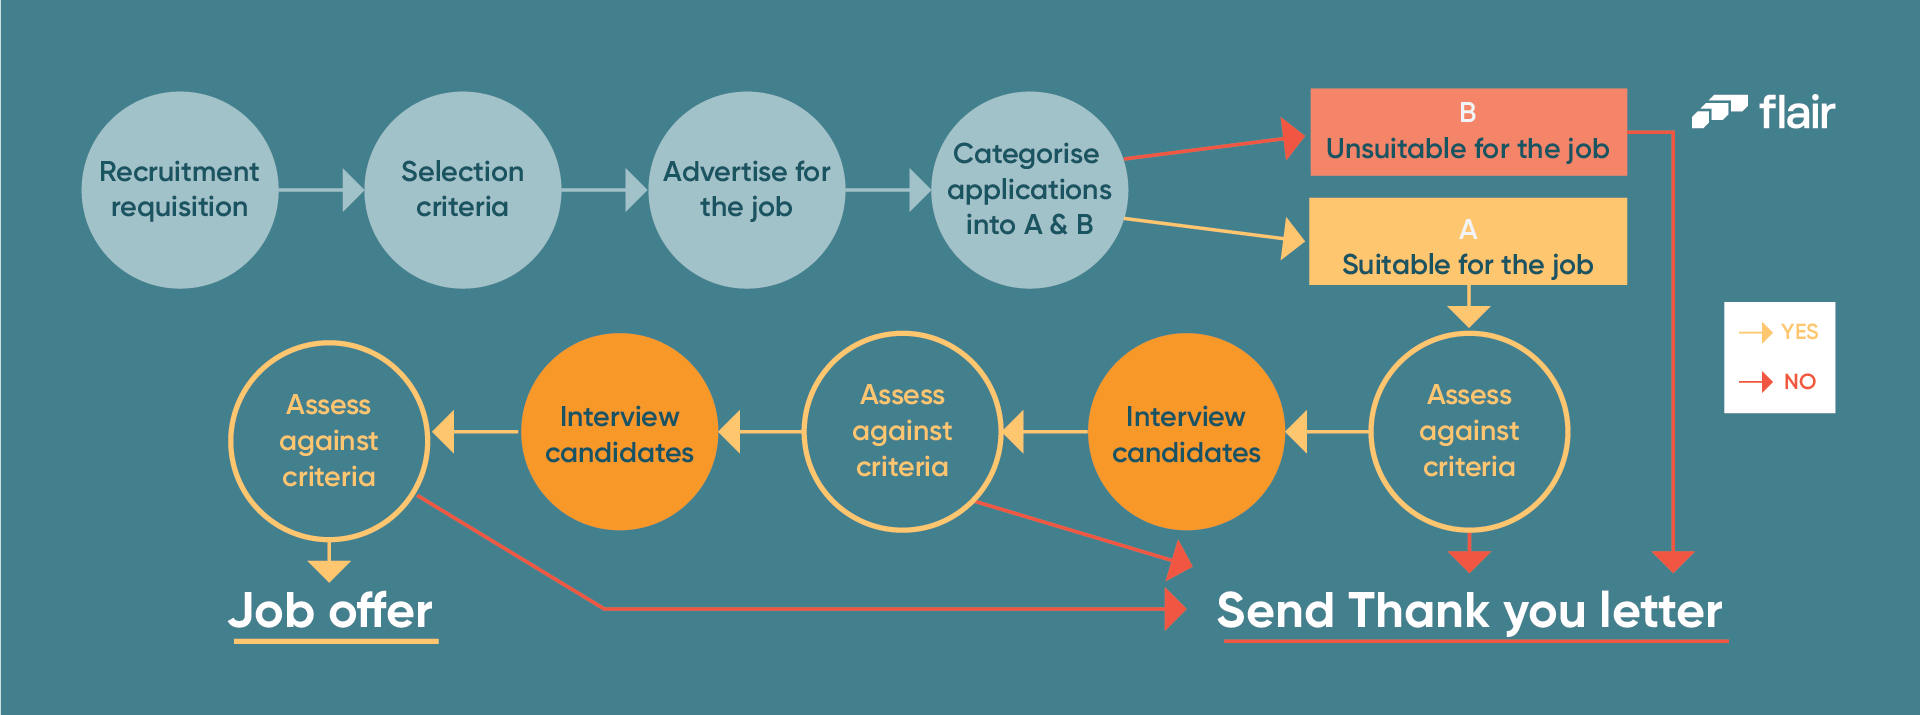
This flowchart is for the process of recruitment within an HR department. Different shapes and colors are used to differentiate between items.
The ‘recruitment requisition’, ‘job offer’ and ‘send thank you letter’ are key steps in the recruiting process, as they are the start and end of the process. The rest of the steps either have one or two potential paths they can follow. How the process plays out is indicated by the arrows joining the items.
Because of how the diagram is laid out, you can clearly see where the process begins and ends.
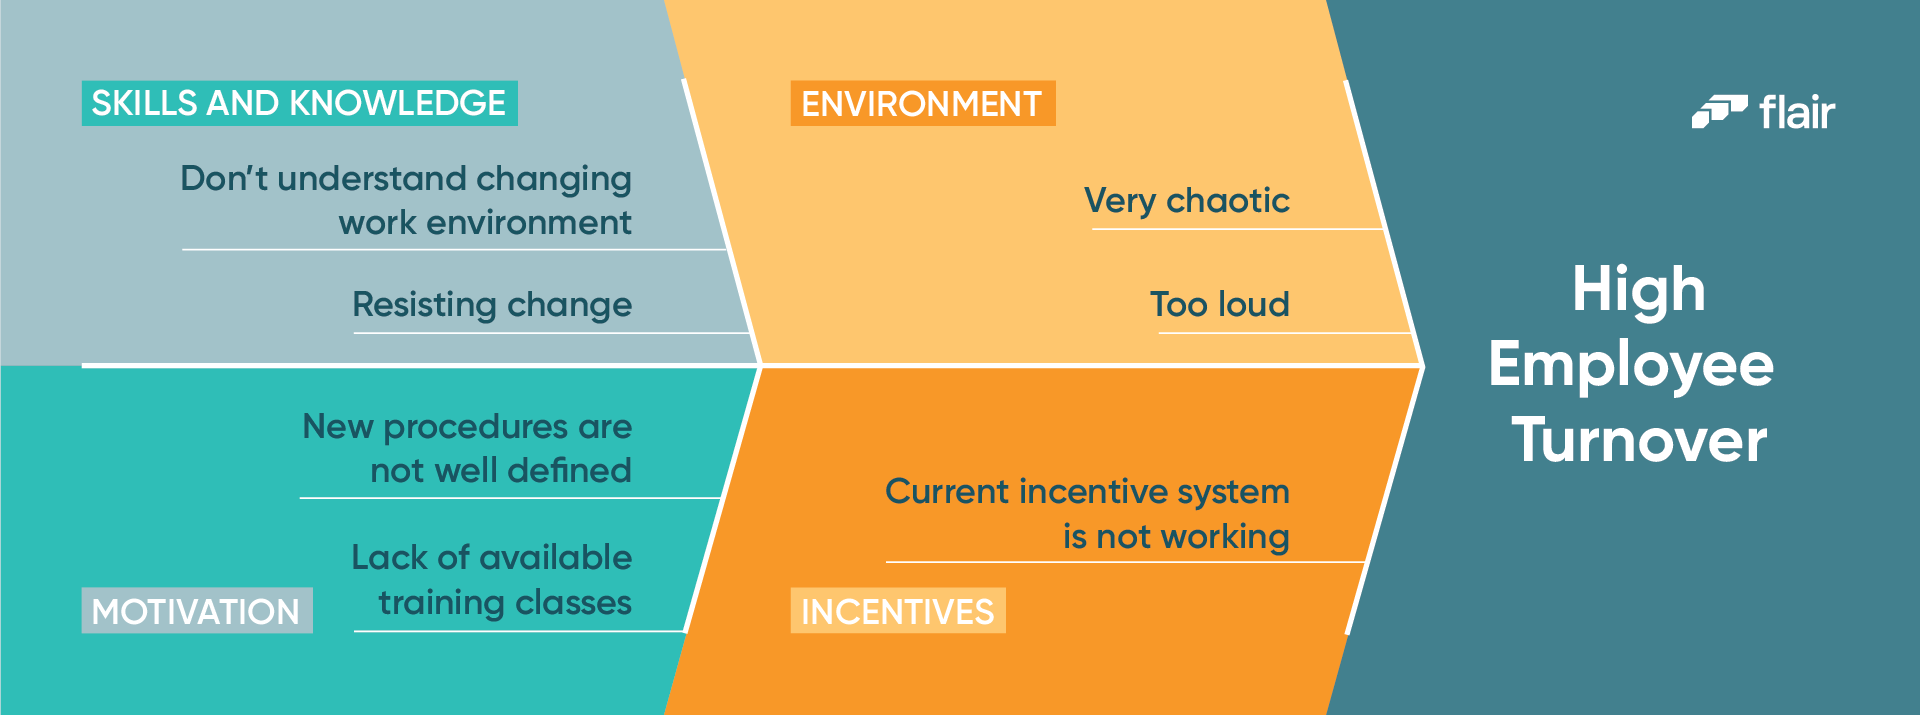
The HR fishbone diagram is the most complex of all the diagrams to understand. Mainly because of its structure.
Here, the head of the fish, which is the problem being faced, is “High Employee Turnover.” The overarching causes of the problem, represented as the fish bones, are: “Skills and Knowledge,” “Environment,” “Motivation,” and “Incentives.” The specific causes are the ‘ribs’ of the fish that branch off from the main bones.
Once you have the problem and its causes laid out like this, it is easy to see where there is room for improvement so you can start reviewing performance and set goals.
Human resource diagrams may be a tool that the Human Resources department predominantly uses. However, the benefits of creating one extend far into the company.
Armed with the knowledge in this article and using the nine steps we outlined above, it should be no problem for your HR team to create an efficient and easily understandable human resource diagram.
Whether you go with the organizational chart, the matrix diagram, the process flowchart, or the fishbone diagram, make sure that you keep your business goals in mind and choose the right one for the job.

Join flair’s newsletter to receive the latest tips & trends in the HR world.

